What CTRs and impressions tell us

Marta Peral Ribeiro (Communications Consultant)
Digital marketing trends in 2020: what CTRs and impressions tell us
We wanted to find out the average click-through rates (CTR) for ads over the course of this year. Although national data on this metric is limited, we know that advertising investment rose between July and September compared with the previous quarter. So what do these numbers tell us?
Marta Peral Ribeiro (Communications Consultant)
Digital marketing trends in 2020: what CTRs and impressions tell us
We wanted to find out the average click-through rates (CTR) for ads over the course of this year. Although national data on this metric is limited, we know that advertising investment rose between July and September compared with the previous quarter. So what do these numbers tell us?
What CTR is and why it matters
In digital marketing, CTR (Click Through Rate) measures the ratio between the number of clicks on a particular link and the impressions (views) it received: a user saw your ad (or a web page, or an email) and actually clicked on it.
CTR = number of clicks / number of impressions x 100.
For example, if your ad has 10 clicks and 1,000 impressions, the CTR will be 1%.
CTR is therefore an important metric in a company's digital marketing plan because it shows which pieces and campaigns performed best, and what can be improved to achieve different results — the higher the CTR, the lower the CPC (cost per click), and so the more effective the marketing campaign.
So if your ad is well positioned in search engines (particularly organically), you stand to get a higher click-through rate and turn those clicks into sales.
By knowing the click-through rate (CTR) statistics and the cost per click for the main social networks and search engines, we can forecast the return on investment that ads may deliver on those same platforms.
The marketing picture around the world — and in Portugal
Fluctuations in paid advertising were to be expected once the pandemic began, as everything became unpredictable overnight.
While companies had to readjust to the challenges of the market, consumers found themselves more immersed in the digital world than ever before.
The fact is that we saw ecommerce take off, as many businesses sped up their move to digital platforms — Portugal included. That growth covers the number of users buying online as well as the volume and frequency of purchases.
Socialbakers' 2020 statistics bear out this shift since last year, worldwide:
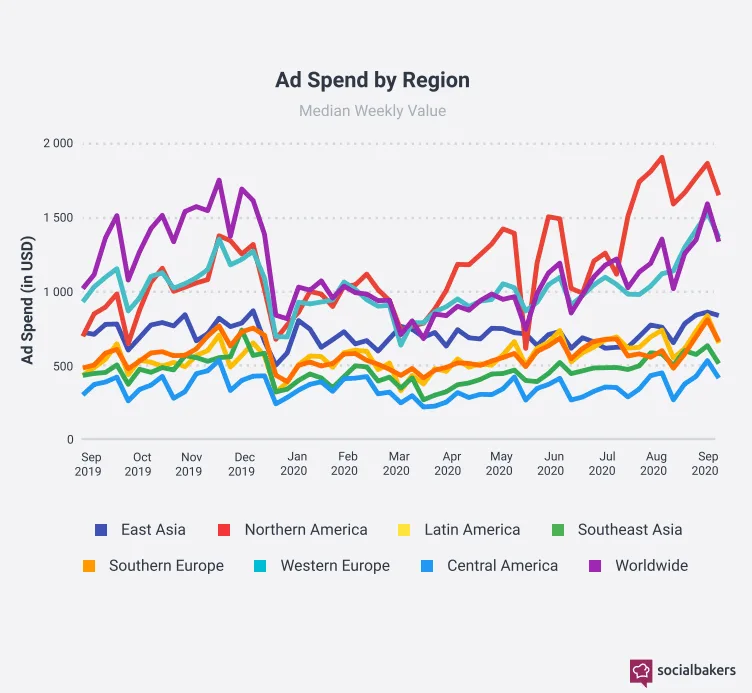
There was a clear rise in paid digital marketing metrics in the third quarter of 2020, which suggests that digital channels really are effective and that many companies are, in turn, more optimistic and are directing their investment towards digital platforms
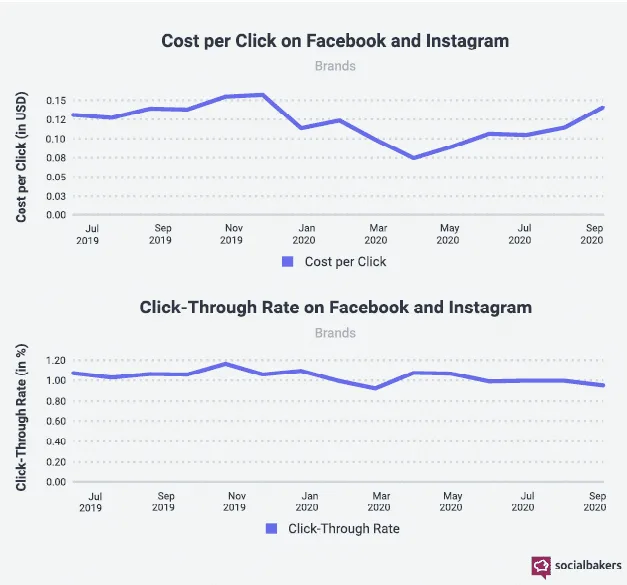
According to the same report, which analysed the Facebook and Instagram accounts of the 50 biggest global brands, one of the metrics that rose was CPC (cost per click). It had fallen at the start of the pandemic but climbed again in the middle of the second quarter, and has kept that trend ever since.
CTR, on the other hand, stayed relatively stable over the same period, dipping only slightly compared with the previous quarter (from 1% between April and June to 0.98% between July and September):
Nationally, there has also been growing investment in online marketing since last year — especially in the past month. In September this year, paid advertising in Portugal was higher than the investment made in September 2019 (€1,007,167 and €958,851 respectively).
The recent study “Economia e Sociedade Digital em Portugal” by ACEPI – Associação da Economia Digital, in partnership with IDC, confirms the trend:
- Portuguese companies are continuing to invest in online marketing, with their main channels being social networks, email and search engine ads;
- There was a 73% increase in users buying around 3 to 5 times a month;
- Domestic commerce is growing, thanks to the greater number of Portuguese online shops.
Marktest's 2020 study “Os Portugueses e as Redes Sociais” also reveals that not only has the number of users who have made purchases on social networks doubled, but 87% visit social networks frequently every day and 70% remember seeing advertising on social networks.
Interactions on social networks
Interactions don't tell you CTRs, but they show you where your audience is, which makes it easier to plan your digital marketing strategy when it comes to channelling ad creative according to your campaign's persona.
On Facebook, interactions include all reactions, comments and shares of posts from another page. On Instagram, they are calculated on the basis of likes and comments on a profile's posts.
· By sector
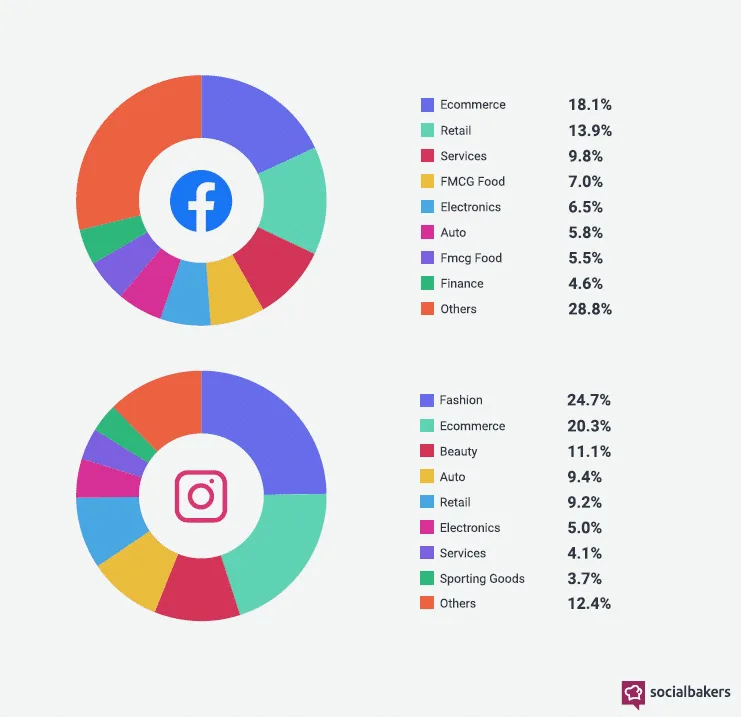
Between July and September, we can see that ecommerce achieved the highest interaction rate on Facebook and the second highest number of interactions on Instagram, behind the fashion sector.
According to the same source, these statistics also hold for the second quarter of this year. As we adjust to the “new normal”, will the trend hold?
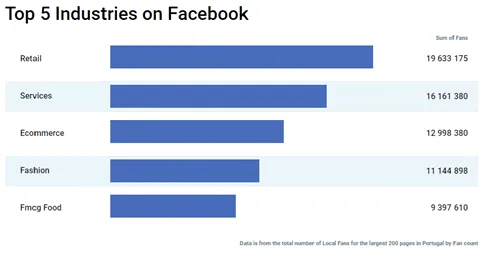
In Portugal, the available sector statistics show that retail topped Facebook over the last two quarters:
· By brand
In September 2020, these were the 5 brands with the highest number of interactions in Portugal:
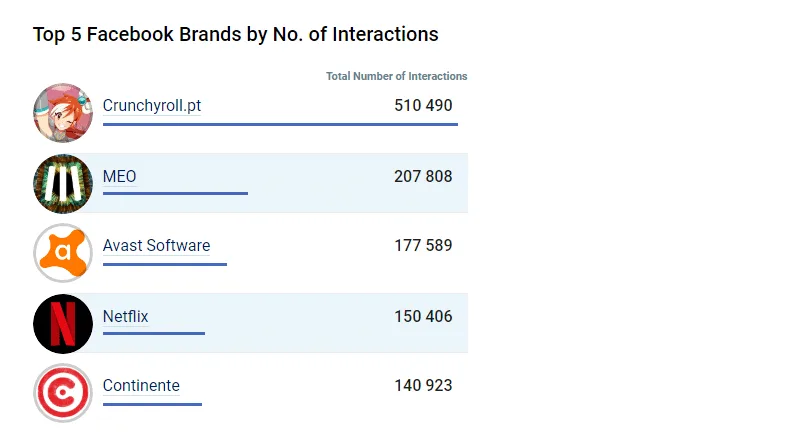
According to Marktest, one of the brands investing most in advertising (although much of it went to other advertising channels) is Continente. It's no surprise, then, that it has featured in this table in recent months (July aside).
Organic advertising
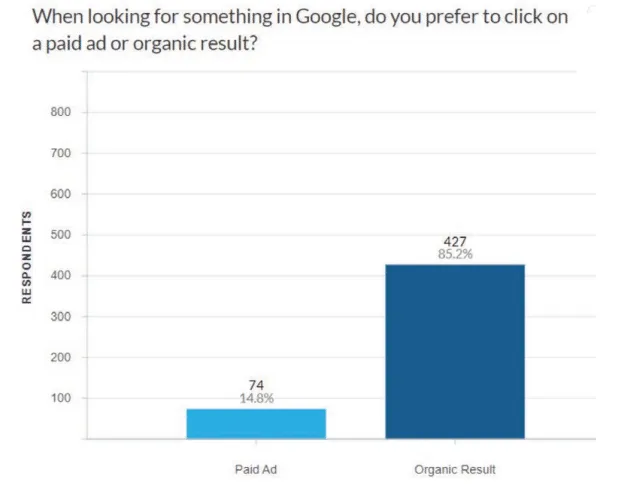
On the positioning of ads in search engines (e.g. Google), which can be organic or paid, an American study of 500 users found that 85.2% choose organic results over paid ads when they search:
On social networks, let's compare follower numbers and their interactions from 2019 to now:
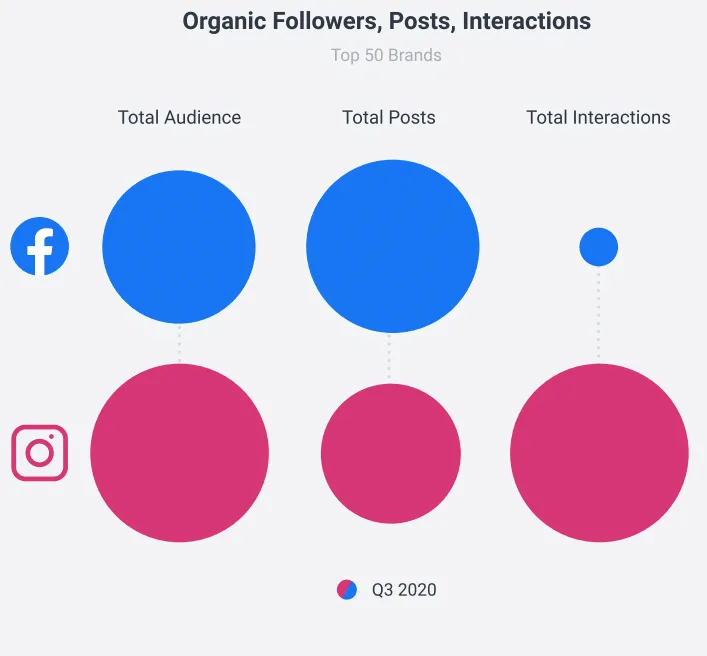
In the third quarter of 2020, the audience for the profiles of the 50 biggest brands was 35% larger on Instagram than on Facebook, as in the second quarter (31.2%), which points to consistent engagement on Instagram.
Compared with the same period in 2019, the position has reversed.
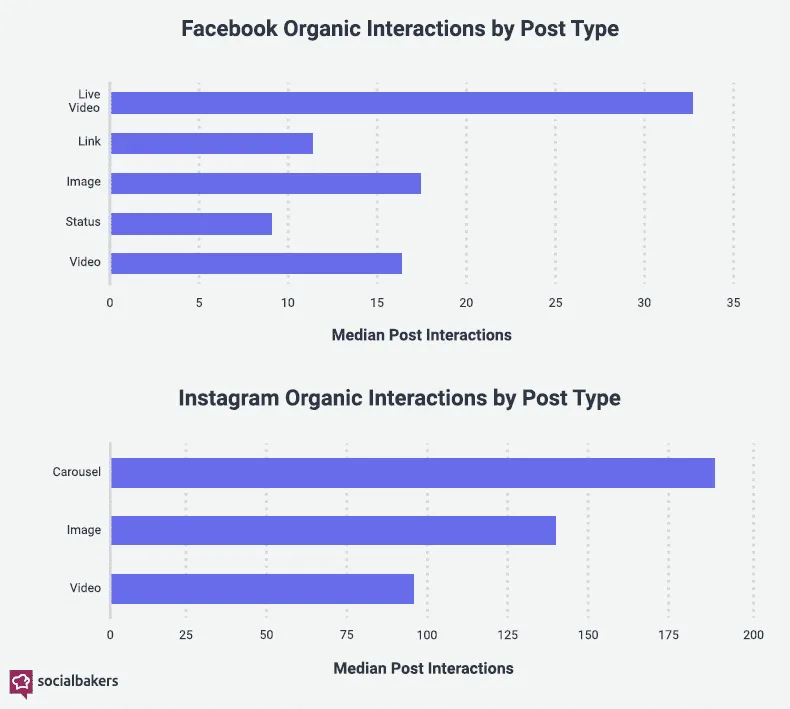
It's also worth looking at organic interactions by post type (image, video, live, etc.):
- Between July and September 2020, globally, live videos were the most successful format on Facebook, followed by images and standard videos.
- On Instagram, the preference was for carousel images, followed by standard images and videos:
What can we take from these studies?
These statistics are particularly useful if you haven't yet invested in advertising (organic or paid) on search engines or social networks, as they allow you to tailor your company's marketing strategy or, alternatively, to forecast your clients' results in quantitative terms and so manage expectations better.
In terms of search engine CTRs (here we're referring to Google, as it's the main one), although these have changed over the years, the goal for most users remains the same: they want a quick, easy answer to their questions. And written content is still the preference, despite growing interest in video content.
As for social network CTRs, Facebook is proving effective for advertising and should certainly be part of your brand's marketing strategy, even though you may find a larger organic audience on Instagram — which may prompt us to revisit our business's persona.
It's important to separate out the different models within an online campaign to work out whether the CTR is high or low, because an ad's performance on the search network isn't the same as that of a display ad. In the latter case, the aim is usually to win views rather than clicks.
Finally, one last point to bear in mind is ad visibility. More and more users are blocking advertising (ad blocking), which prevents ads from being seen and drives down a campaign's performance.

Get what we write
No fixed calendar: only when there is something worth your time.